Hydro Northwest > Oregon
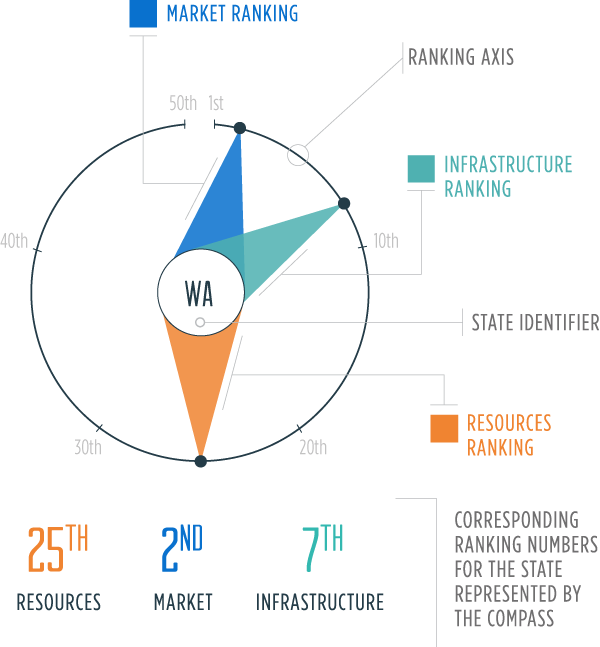
Resources: A measure of total energy production and consumption per capita
Market: The cost of consumption, measured in electricity prices and gasoline taxes
Infrastructure: Capacity to generate and refine energy sources; miles of pipelines
Limited amounts of coal are shipped by rail from Wyoming and Montana to meet the state's energy needs, but only .5% of Oregon's net electricity generation comes from coal-powered power plants—well below the national average of 36.8%.
Residential electricity prices are well below the national median due to abundant hydroelectric power.
Wind energy provides most of Oregon's net generation from non-hydroelectric renewable resources.

Production trillion btu
Oil
Gas
Coal
Wind
Solar
Hydro
Biofuel
Nuclear
net energy Production trillion btu
Consumption trillion btu
Oil
Gas
Coal
Renewable
Nuclear
Gasoline Tax total state + federal, 2014
OR
USA
Key Policies
Requires large utilities to ensure that 25% of retail electricity sold in-state be derived from renewable energy resources by 2025.
Is one of only three states that enforce emissions standards for new or expanded power plants, and for all electricity imported into the state.
Requires the use of oxygenated motor gasoline throughout the state.
Requires permits and compliance bonds for oil and gas wells. Compliance bonds begin at $25,000.
Electricity net production, trillion btu
OR
USA