Midwest Core > Missouri
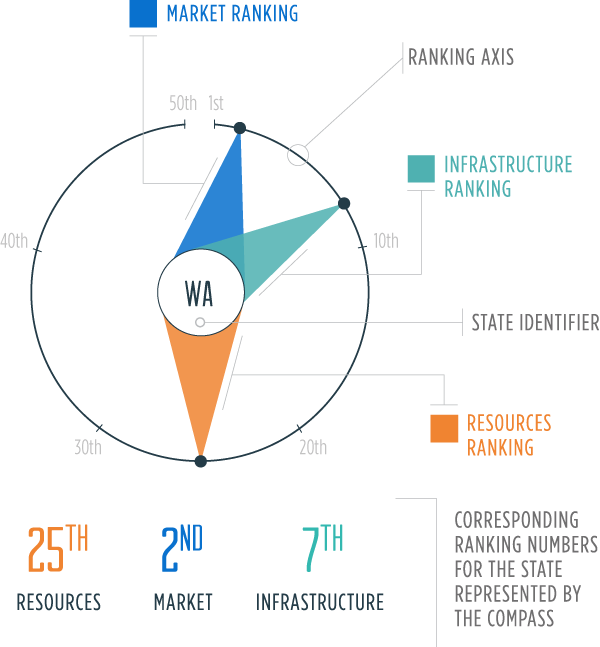
Resources: A measure of total energy production and consumption per capita
Market: The cost of consumption, measured in electricity prices and gasoline taxes
Infrastructure: Capacity to generate and refine energy sources; miles of pipelines
Missouri only produces 1% of the coal it consumes. Most of the coal fueling the state's coal-fired power plants comes by rail from Wyoming, and small amounts arrive by rail and truck from several other states, primarily Illinois.
Transportation is the largest energy-consuming sector in Missouri. The state is a national transportation hub on account of its central geographic location at the intersection of the three largest rivers in North America.

Production trillion btu
Oil
Gas
Coal
Wind
Solar
Hydro
Biofuel
Nuclear
net energy Production trillion btu
Consumption trillion btu
Oil
Gas
Coal
Renewable
Nuclear
Gasoline Tax total state + federal, 2014
MO
USA
Key Policies
Requires investor-owned electric utilities to increase the percentage of electricity sales from renewable resources incrementally to a minimum of 15% of total sales by 2021.
Requires statewide use of oxygenated motor gasoline. The St. Louis and Kansas City metropolitan areas require additional ethanol and low vapor pressure blends, respectively.
Requires permits and surety for drilling oil and gas wells. There are no permit fees. Surety bonds start at $1,000 and increase for deeper wells.
Electricity net production, trillion btu
MO
USA