Overview
The U.S. is one of the world’s largest consumers of energy and recently has enjoyed a renaissance as a major energy producer. The U.S. energy landscape comprises 13 regional constellations of energy markets and infrastructure. These regions are distinguished by geographic linkages, geologic features, infrastructure networks, energy resources and energy consumption trends.
This site highlights these 13 unique regions and enables users to explore connections and compare and contrast key indicators.
Data
Facts and figures cited in region and state copy were drawn from sources and databases as of April 2015. All production and consumption data is from 2012 unless otherwise noted, as this was the most recent year for which complete state-level data is available. Although more recent population data is available, we used 2012 census figures. This way, when calculating, for example, energy production per capita, all data represent the same year.
Production and consumption data is shown in British thermal units (Btu) as a standard way to compare all energy sources included in this data set.
Federal offshore production of natural gas and oil is included in the national totals. Offshore totals within state waters are included in state production figures.
Gasoline taxes represent the total of federal, state and local taxes as of January 2015. The American Petroleum Institute uses a weighted average of local taxes by population of each municipality to come up with an average tax for the entire state.
Electricity prices represent the state average for the period 2000-2013. For the “Electricity Price” components of the Market rankings, prices represent state averages in each of the four end-use sectors (Residential, Commercial, Industrial and Transportation) for the period 2000-2013.
Other production represents all production – biomass, solar geothermal, traditional geothermal, etc. – that does not fall into one of the other eight fuel types.
Total Consumption reflects, per U.S. Energy Information Administration methodology, the total of five fuel types. In this data set, the total consumption of hydropower, wind, solar, biomass, geothermal and all other renewables are combined into a category called Renewables. Added (or subtracted, as appropriate) to this is the “net interstate flow” of electricity. Meaning, for example, if a state consumes 1000 Btu of energy, but exports 500 Btu of electricity, their total consumption is recorded as 500 Btu.
In the calculation of Infrastructure ranking, the following components are weighed:
- Total Capacity – The total output capacity, in barrels, of all petroleum refineries in the state in 2014.
- Total Transmission Pipeline – The total mileage of natural gas and oil transmission, processing and collection pipelines in the state in 2014.
- Total Generation Capacity – The total nameplate capacity, in MW, of all electricity generation plants in the state in 2014.
Ranking
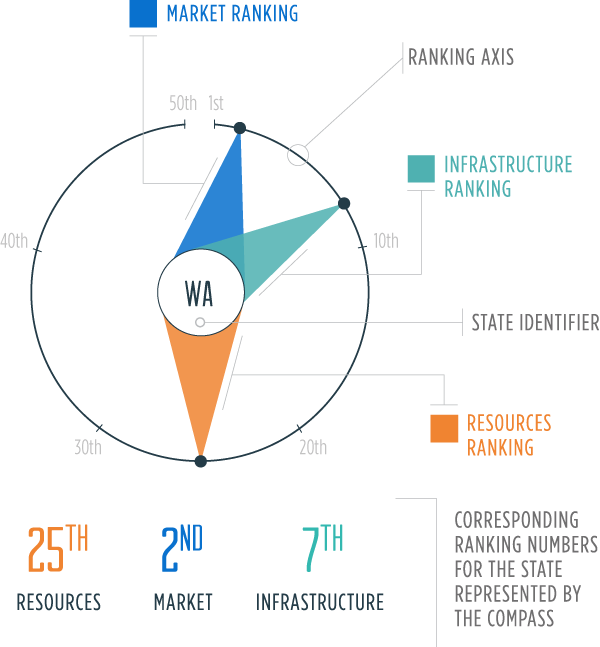
The Energy Constellations are filtered through four categories – Resources, Market, Infrastructure, and Policy.
Each category includes both qualitative and quantitative components, with the exception of Policy which includes only qualitative information. The quantitative components are further narrowed down into an equation used for ranking which captures only the most important indicators. Below, we outline how each category is broadly constructed, and then specify how the ranking equation is developed.
The first three components can be analyzed numerically, providing a common means of comparing data across state and regional lines. For each component, various metrics are aggregated and ranked, producing an overall score. This score is then ordered, yielding a rank for that state for that particular component. This gives a snapshot view of how that state is performing across a family of metrics, relative to all other states.
Resources
This category reflects how a state or region’s energy resources are utilized through production and consumption. The key metrics are total energy production (the total amount of energy produced within the state or region) and production across fuel types (a more detailed breakdown which disaggregates oil, natural gas, coal, wind, solar, hydropower, and nuclear). Resources also includes consumption across fuel types as a natural corollary to production, and as a reflection of a state or region’s ability to both refine energy and import it as necessary.
Resources: Rank (average([rank {net production}] + [rank {production per capita}] + [rank {production per square mile}]))
Market
This category reflects a state’s consumer base, and how that base interacts with the available energy market. The Market category comprises an aggregate ranking of energy consumers (—how many, which sectors, etc.), the cost of consumption (prices for electricity in the residential, industrial, commercial and transportation sectors), and the gasoline tax in each state.
Market: Rank (average([rank {gasoline tax}] + [rank {electricity priceresidential}] + [rank {electricity pricecommercial}] + [rank {electricity priceindustrial}])
Infrastructure
This category represents an aggregate ranking of the existing energy production and transmission infrastructure in each state, including total power plant generation capability, oil refinery capacity, and total miles of transmission pipelines for oil and natural gas.
Infrastructure: Rank (average([rank {total power plant capacity}] + ([rank {total miles of transmission pipeline}] + ([rank {total refinery capacity}])
Policy
The policy category reflects pertinent state energy legislation and practices and, —when applicable, regional policies developed through state cooperation or regional utility bodies. Whenever possible, we have tried to identify renewable energy portfolio standards and goals, oil and gas drilling permit fee and compliance bond information, and gasoline tax and fuel mixture requirements, as these issues are fairly easy to compare across states and directly relevant to energy production and consumption.

