Sweeping Plains > North Dakota
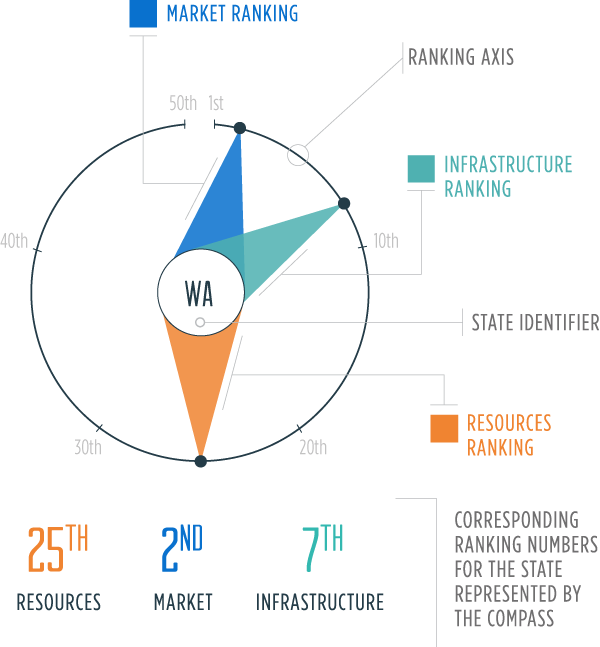
Resources: A measure of total energy production and consumption per capita
Market: The cost of consumption, measured in electricity prices and gasoline taxes
Infrastructure: Capacity to generate and refine energy sources; miles of pipelines
Crude oil production in North Dakota increased tenfold from 2003 to 2013, primarily as a result of horizontal drilling and hydraulic fracking in the Bakken Shale.
North Dakota's energy boom has transformed the state's energy landscape and led to strong growth in employment and record low unemployment rates. The economic ripple effect of the boom is evident in neighboring states, as well.
North Dakota’s total energy consumption is among the lowest in the nation due to its small population. But the state’s consumption per capita ranks among the highest, in part because of the energy-intensive industrial sector and high heating demand in winter.

Production trillion btu
Oil
Gas
Coal
Wind
Solar
Hydro
Biofuel
Nuclear
net energy Production trillion btu
Consumption trillion btu
Oil
Gas
Coal
Renewable
Nuclear
Gasoline Tax total state + federal, 2014
ND
USA
Key Policies
Adopted a voluntary renewable portfolio objective that set a goal for electricity generated from renewable sources of 10% of all retail electricity sold in the state by 2015.
Allows the statewide use of conventional motor gasoline without ethanol.
Requires permits and compliance bonds for oil and gas well drilling. Permit fees are $100. Compliance bonds are $50,000 per well, although wells of 2,000 feet or less may be bonded in a lesser amount upon administrative approval.
Electricity net production, trillion btu
ND
USA